Heat Maps
…I have not shrunk back from declaring to you the whole counsel of God.
– Acts 20:27

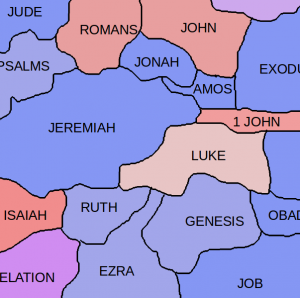
If you’ve watched the news lately, you have probably seen one or more heat maps. A heat map uses areas of different colors to give an overall picture of some kind of statistic. For example, weather reports will sometimes show ocean temperatures in the Pacific to indicate if we’re heading for an El Niño or La Niña. And while technically not a heat map, we’ve all seen recent maps of the United States election results colored red or blue by county. I like heat maps, and it got me thinking of a biblical application.
What if you could view the entire Bible as a map, divided into books and chapters (like states and counties), or divided into topics. How would that map look if it were colored based on what areas you tend to study over the years. Or if you’re a pastor, how would the map be colored based on the subjects of your sermons? Well-studied areas would be red, and little-studied areas would be blue. If you can picture such a map in your mind, would you have large areas of blue because you tend to focus on a few favorite books or topics? Or would the map be mostly red?
